It is always bittersweet when a project ends that involved a long-time investment and connected you to many different artists, art works and unusual experiences. I have been following most of the 13 fiber artists of Maryhill Museum’s 2022 Exquisite Gorge II project for almost a year, traveling to their studios and residencies from Ashland to Kennewick, and many places in-between. (Here are all of the profiles that I ended up writing, all in one place.)
Tammy Jo Wilson, Owen Premore, Amanda Triplett with student collaborator.
Bonnie Meltzer, Lynn Deal.
Chloë Hight, Xavier Griffith, Carolyn Hazel Drake and Husband.
Magda Nica, Ophir El-Boher.
Kristy Kún, Francisco and Laura Bautista.
I’ve gotten to know them, admire them, envy them – and most of all I got to think about diverse approaches to create artistic representations of sections of the Columbia River and the Gorge. They were at the heart of the project that connected 11 installations of enormous creative range along the Maryhill Museum Driveway this weekend, a festive celebration by and of community, the many involved area partners to the artists who contributed selflessly and substantially, and the many visitors who came to admire the work.
I also realized how much work is involved behind the scenes, the sweat and labor we never get to experience when we just go and visit an exhibition. There are practical challenges, strokes of bad luck when people are forced to drop out, or promised help fails to materialize. We also do not get to see all the time invested in travel to and from the community partners, the extra cost required by tricky materials, or the realization that some design ideas are brilliant but not able to withstand the weather elements, notoriously fickle in the Gorge.
My fears that the final event after such a long, interesting and difficult run might be anti-climactic were unfounded. It all came together with visible joy and enthusiasm – I will let the photographs (mostly) speak for themselves.
Louise A. Palermo, Curator of Education, was a driving force, in more ways than one. Her connection to and support of the artists and her involvement with the community partners, let alone organizing the technical specs and details of the final event, were moving the project forwards. There was literal driving as well – long stretches to facilitate my visits with the artists, hauling the frames for the installations to and fro, and eventually driving the forklift that brought the finished art works out onto the museum drive.
Multiple volunteers helped in ever so many ways, sustaining the yarn bombing, the poppy project, manning the various booths that helped introduce visitors to different ways of manipulating fibers. At the day of the event, many helpers managed to set the frames in place and secure them on rails that had also been built by friends of the museum.
Cindy Marasco, who saved me from starvation with an ice chest full of goodies, guarded my gear and was all around wonderful to talk to when we hung out in the shade when I had to rest, and her husband Ryan Mooney, who built the tracks.
Chris Pothier and Dylan McManus.
Visitors enjoyed the activities on hand, including a sheep shearing demonstration by M&P Ranches,
Merrit and Pierre Monnat of M&P Ranches
and a story walk created by the Fort Vancouver Regional library and the Klickitat County Book Mobile.
Here are some of the other activities on offer:
Judy learned felting!
Most of all, however, visitors congregated around the finished installations, admired the incredible range of what was shown, and listened to the individual artists giving short talks explaining their process.
They eagerly photographed the QR Code that linked to detailed information for each piece, clearly engaged.
Many visited the museum itself, at one point in time registering over 350 visitors simultaneously, approaching limitations.
Wilson and Premore Frontispiece, seven crocheted mountains on top of the sturgeon, aquatic plants printed, and quilted fabric from Premore’s grandmothers who lived in the region.
Here are some details from the installations – to experience the full beauty you have to visit yourself – they will be in display for over a month starting now. Or you can take a virtual tour here with a short video produced with the help of canine Daisy…
***
A parade of hats was a feast for the eyes, elegant protection from an increasingly hot sun – remind me to get one of those for future occasions!
with people seeking shade for picnics or the delicious food sold by a Mexican caterer,
and dogs happy when they eventually found some shade as well.
In other words, a great success, for the museum, for the artists, for the many in the community who contributed in so many ways.
It all goes back to the river. The land that has seen hope and heartbreak, new opportunities at the cost of displacement of those long here before colonial settlers arrived. It struggles with fires and floods, with economic inequality, competition for access to ever diminishing resources of water and fish, with questions of what a future might hold and who will be privileged to enjoy that future without having to leave home or traditional vocations. The art installations reminded us of much of that.
Equally so, Saturday’s celebration showed the resilient spirit that unites many of the people of the region: a pride in and connectedness to the river, well aware what an incredible resource it is and how it deserves protection. May art be a guardian of that mission.
Details of work by Meltzer (front) and Kún (back felting.)
Three cheers for an institution – the museum – to help us remember all this through the Exquisite Gorge Projects.
Cant’ wait to see what Exquisite Gorge III will hold.
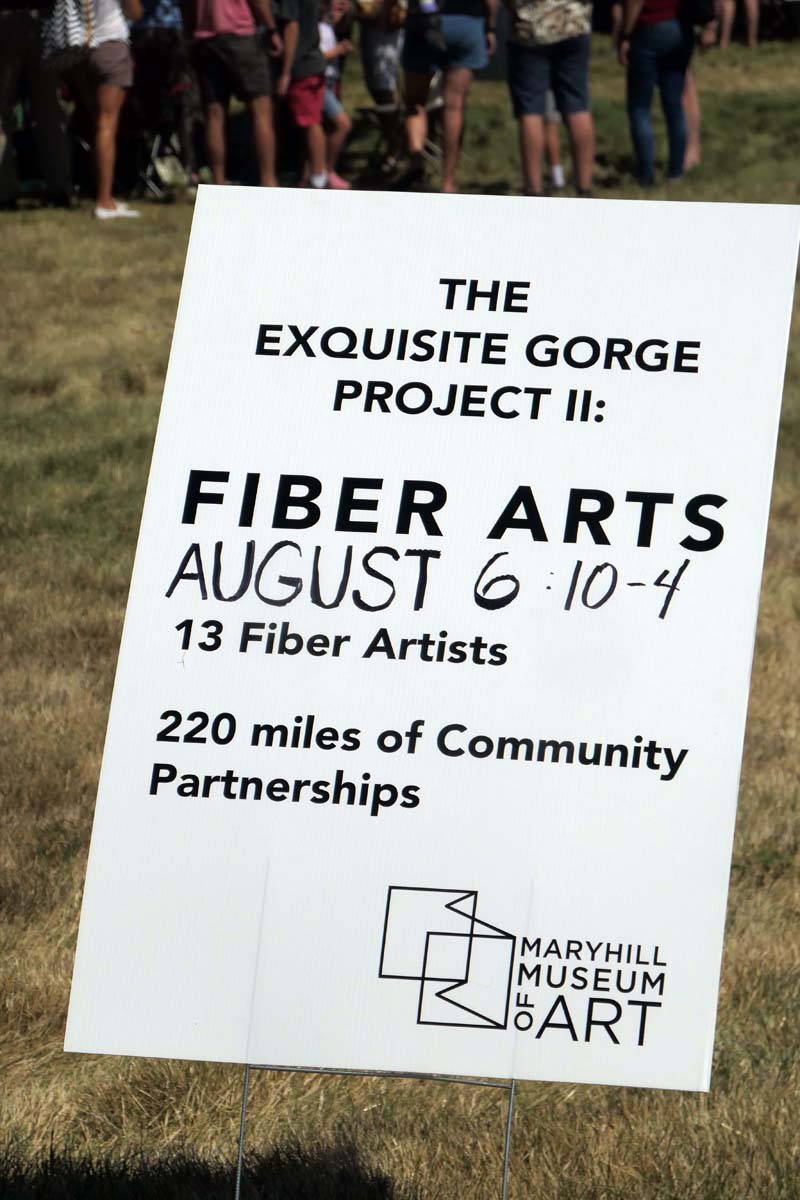
“…a collaborative fiber arts project featuring 13 artists working with communities along a 220-mile stretch of the Columbia River from the Willamette River confluence to the Snake River confluence. The project, again initiated by Maryhill Museum of Art and following the original one by printmakers in 2019, takes inspiration from the Surrealist art practice known as exquisite corpse. In the most well-known exquisite corpse drawing game, participants took turns creating sections of a body on a piece of paper folded to hide each successive contribution. When unfolded, the whole body is revealed. In the case of The Exquisite Gorge Project II, the Columbia River will become the ‘body’ that unifies the collaboration between artists and communities, revealing a flowing 66-foot work that tells 10 conceptual stories of the Columbia River and its people.”
Section One: Oregon Society of Artists–Artist: Lynn Deal Section Two: Lewis and Clark College–Artist: Amanda Triplett Section Three: Columbia Center for the Arts, The History Museum of Hood River County and Arts in Education of the Gorge–Artist: Chloë Hight Section Four: White Salmon Arts Council and Fort Vancouver Regional Library–Artist: Xavier Griffith Section Five: The Dalles Arts Center and The Dalles-Wasco County Library–Artists: Francisco and Laura Bautista Section Six: The Fort Vancouver Regional Library at Goldendale Community Library–Artist: Carolyn Hazel Drake Section Seven: The American-Romanian Cultural Society and Maryhill Museum of Art–Artist: Magda Nica Section Eight: Desert Fiber Arts–Artist: Ophir El-Boher Section Nine: The Confederated Tribes of the Umatilla Indian Reservation–Artist: Bonnie Meltzer Section Ten: ArtWalla–Artist: Kristy Kún Frontispiece: Tammy Jo Wilson (project artistic director) and Owen Premore
Stick with me, folks, even if the mere mention of “scientificdata” makes some of you want to shut your ears and avert your eyes. It’s going to be a playful, wild dive into the patterns of wind and water, electricity and pollution, geological formations and human experience around the Columbia river basin. All brought to you by yet another innovative artist, Amanda Triplett, and her team of Lewis & Clark College students involved in Maryhill Museum’s Exquisite Gorge II project, tackling the translation of numbers into pictures or something one can see – data visualization – with remarkable creativity.
Italo Calvino’s words about translation applied to his own work being translated into many languages, exposing his work to the world beyond Italy. One of his seminal books, Invisible Cities, focused on the reverse, bringing the world to someone who lacked access despite being the ruler of endless countries. The Venetian explorer Marco Polo told the emperor of Mongolia, Kublai Khan, about the truths found in his realm, translating foreign concepts into a form that could be easily grasped and universally understood.
We are looking at bridge building then, crossovers between different worlds. In some ways one can think of the domains of science and art in this way as well, as two different countries with different languages that need translation. Two realms in need of connection.
All photographs of individual small fiber sculptures are from the tapestry wall that is part of the project process. Participants were encouraged to “play” with recycled fabric bits and pieces.
Science is a domain ruled by methodic, structurally constrained exploration of data intended to add to a knowledge base that might explain our world. That knowledge base is organized in the form of testable predictions derived from our hypotheses of how our universe functions.
Art is a domain that frequently wants to explain the world as well, rather than just depict it. But the approach is much less regulated. No immutable rules as seen in the scientific method, no constraints on what counts or doesn’t count as fact, no limits to emotional engagement or manipulation. In (admittedly overly) simplistic terms, science wants us to know and understand, art wants to make us think and feel.
Both tell a story, constrained by rigid rules for science, open to unlimited embellishment for art. The language they use to tell their story is shaped by those factors. So how then do you translate from one to the other? And, importantly why would you want to do that in the first place?
You might argue that science and art embrace complimentary ways of viewing reality which are not a substitute for each other. Yet translating scientific data into something other than numbers, or even into art, when done successfully, has major advantages. For one, it might reach many more eyes and ears than any old scientific paper, given the sad fact that a lot of people have negative associations to scientific data or a fear of approaching them. They might not trust them, or they might not understand them, given the lack of science education all around. They might not have the patience to wade through them, or they might not have access in the first place, given that so much has to be gathered to depict a complete story. Importantly, something we can see rather than just reading about it, might deliver much more of an emotional punch which in turn could translate into engagement with the issues, or action. If a picture is worth a thousand words, think what sculpture might do to a million numbers…
This was the impetus for Amanda Triplett’s approach to interacting with her college students, colleagues and assorted scholars when devising a plan to translate the scientific data collected around the Columbia river and NW regions into a visual language. (Her contributors can be found listed below.) She utilized the many resources available on a college campus, access to the folks from environmental sciences, data librarians, tech support and so on, and in the process made connections between the various fields, translating various “languages” into an artistic narrative.
The Edging Plate for Last Year’s Exquisite Gorge Print Project, with Lewis&Clark Artists also covering Section 2, From Mile 110 to McGowan Point
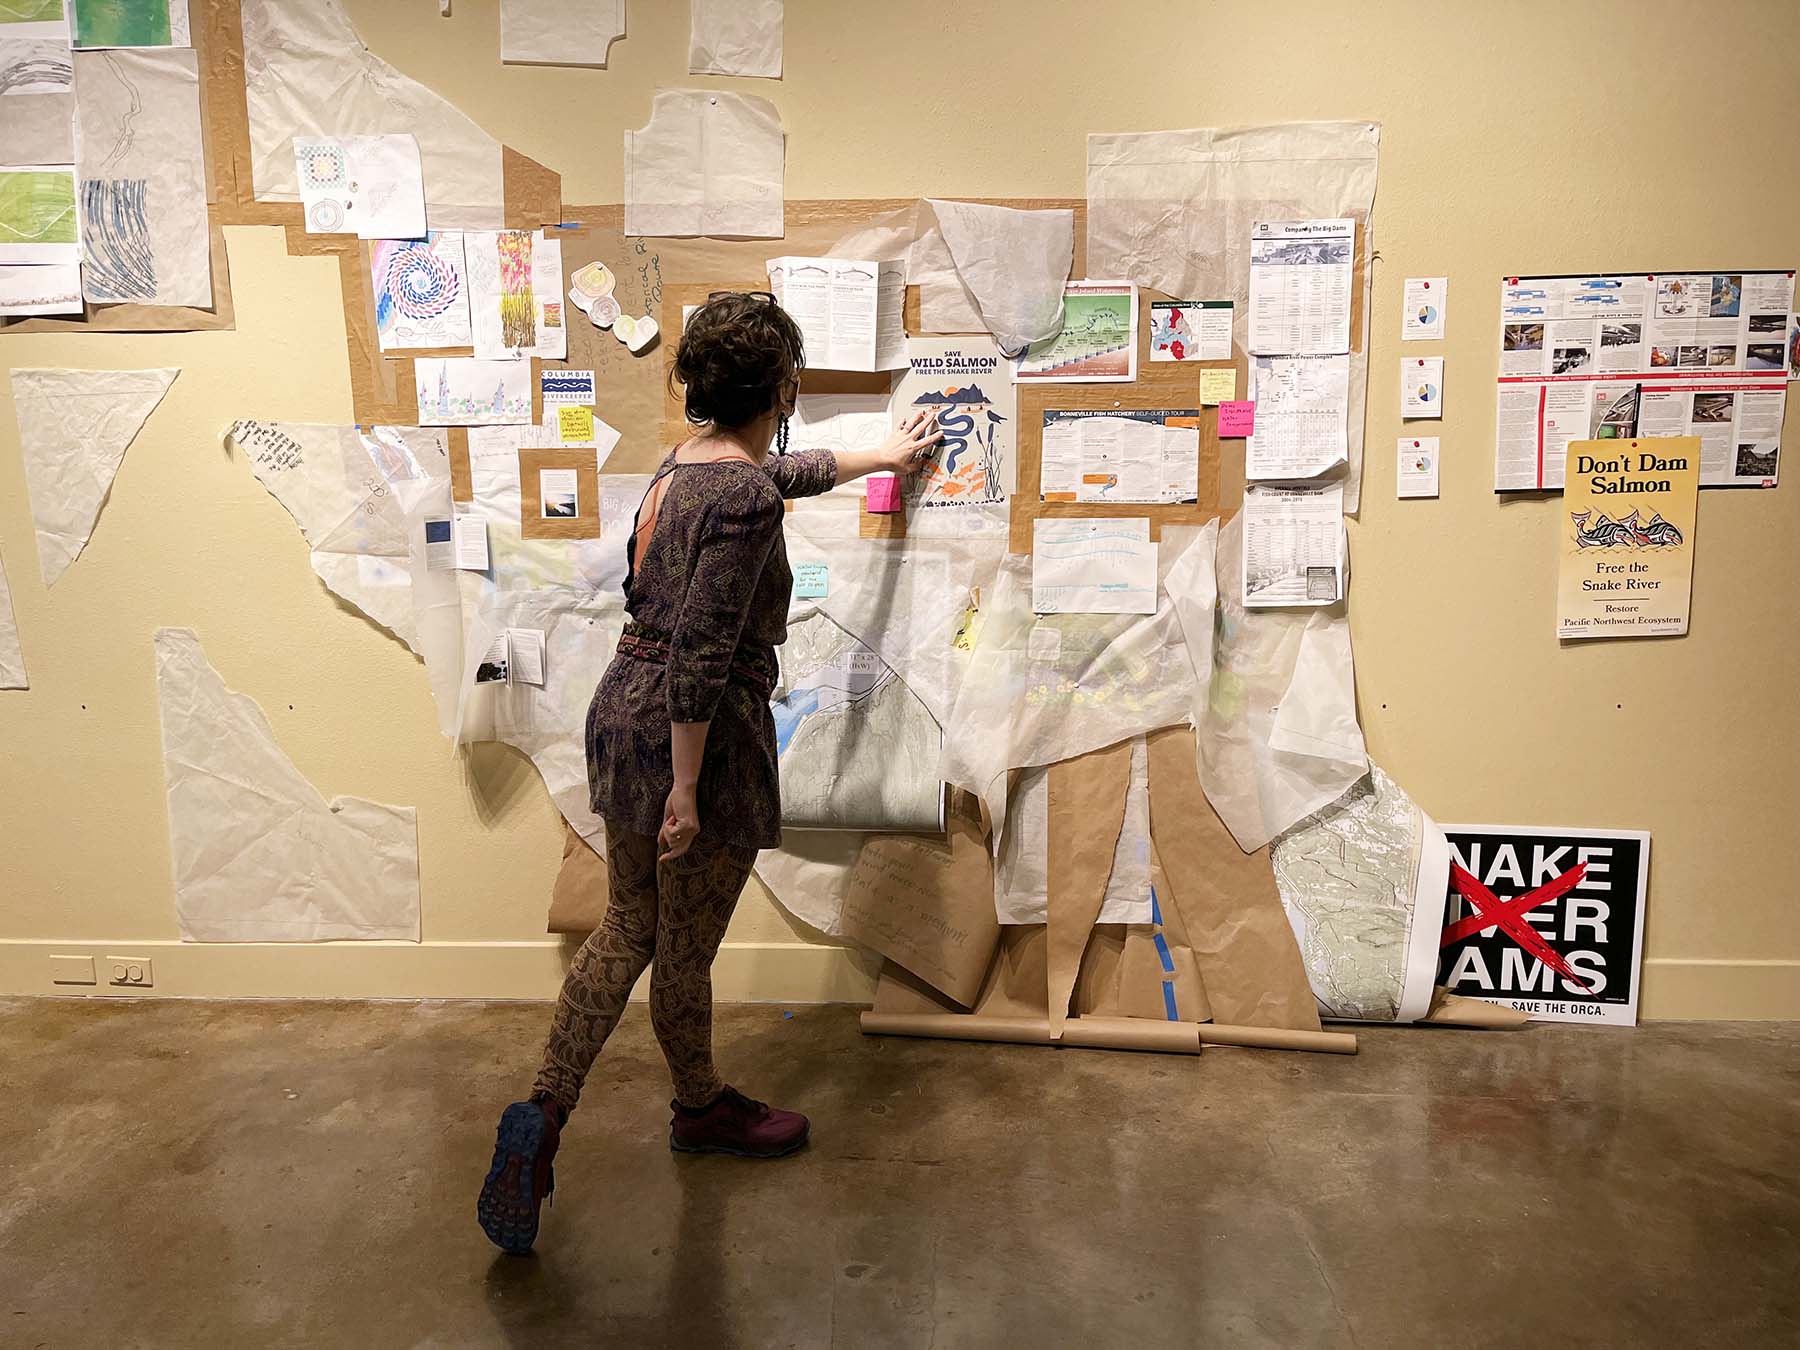
The artist in front of a gallery wall depicting the accumulated data and cut patterns
The process as it unfolded can be currently seen documented on the walls and displays of Lewis & Clark’s Ronna and Eric Hoffman Gallery. (It’s up until July 28th. Open Monday-Thursday 10:00am-2:00pm except July 4th.) It is still an active workshop, with fiber details being created, and the final sculpture put together. Really worth a visit, parking on the empty campus is easy and free, and public transport available.
“All translation is a compromise – the effort to be literal and the effort to be idiomatic.” — Benjamin Jowett
The first steps included which data to look for and to grasp what data visualization implies. It is basically the practice of translating numbers into a visual context, so they are more easily understood and allow us to find patterns or trends or outliers, things that do not conform with what we understand to be the norm.
Here is a simple example: if you look for advice on when there are the fewest number of visitors at Portland Art Museum so you can safely visit, or be least disturbed, all you have to do is go to Google Maps. They offer a picture, a bar graph that shows you in simple form what otherwise would involve reading through hundreds of statistic on daily visitor rates and density. And that still would not allow you to decide in the moment, which is the advantage of these interactive live maps provided by the institutions, coded in red bars. Voila, this Friday at 11 a.m. was the best time to visit.
Google Jam Board from Brainstorming Session
There are tons of ways in which data can be presented visually. Bar graphs, scatterplots, heat maps, box plots, line graphs, pie charts, area charts, choropleth maps and histograms all serve particular purposes. The participating students in this project all learned about these tools with the very concrete goal in mind how to represent the information about the Columbia river region in yet a different modus: using fiber to create art. Due to the pandemic, the initial months of the project took place on zoom, with Google jam boards collecting and displaying information that might be relevant. The digital brainstorming centered on representing data, but also concerned ways of understanding how traditional use, or mis-use, and abuse of data can influence how we see the world.
Once back in person, the group listened to experts, had discussion sections, took a field trip to the river and Bonneville Dam for data collection, and learned from presentations by the Columbia River Keepers about the current state of affairs of environmental facts, woes included. It became clear that all things are interconnected and cannot be judged in isolation. Dams, as just one example, provide hydro-power and regulate shipping. A good thing from a consumer perspective, but they also destroy fish habitats and spawning abilities, affecting not just salmon populations but also the cultures of Native Americans on whose land dams were built and who depend on salmon for existential and ceremonial reasons. Water use, as another example, benefits agricultural businesses, but stands in competition with river health and fishing rights in times of increasing droughts.
But how to translate this into fiber art?
Here are three examples that were generated by the project participants:
1. Energy across Oregon and Washington is drawn from multiple sources in varying amounts. Hydropower, harnessed by the dams, generates about 48%, natural gas base load is next (18%) and in descending order coal, wind, natural gas peak load, nuclear, biomass and solar are filling our needs. Each energy source is color coded.
A distribution of these resources, as seen in the pie-chart data visualization was knitted or crocheted with the exact amount of stitches and colors representing each percentage, surrounding a lightbulb representing electricity use.
***
2. Solid pollutants like fishing lines, mesh bags and other odds and ends were collected from the river and fabricated into a sculptural configuration (photograph below)to visualize what sickens the water and fish. The pebbles beneath represent parts of the carbon cycle. Carbon sinks, like forests and oceans of a certain temperature, absorb emitted carbon dioxide from the atmosphere, yet are increasingly depleted. Carbon sources, on the other hand, like the burning of fuel stored in fossils, and maintaining large livestock operations, are continually in use or even increasing, despite the havoc they wreak on our climate.
***
***
3. Other participants looked at the composition of the river, including the geological history of the Columbia River Basalt Group which consists of seven formations: The Steens Basalt, Imnaha Basalt, Grande Ronde Basalt, Picture Gorge Basalt, Prineville Basalt, Wanapum Basalt, and Saddle Mountains Basalt. Many of these formations are subdivided into formal and informal members and flows. One proposal, in the process of being beautifully executed right now, was to make a topographic map.
And then, of course, there is the river itself with its eddies and currents, its waves and flow, carefully constructed with recycled fabrics, salvaged upholstery, some wool, the center piece of the display.
***
“Translation is not a matter of words only: it is a matter of making intelligible a whole culture.” — Anthony Burgess
I met Amanda Triplett 2 years ago when I first wrote about her work for Oregon Arts Watch.
“TRIPLETT HOLDS A B.A. in Art and Art History from Sarah Lawrence College in New York. Starting out as a performance major, she soon switched to visual art, mostly focused on drawing and other works on paper. She credits the fact that she was raised in fabric-rich societies like Egypt and Taiwan, with parents later living in India, with her eventual settling on fiber sculptures. Her intention to work with discarded materials found the perfect source: Shortly after she moved to Portland from California in 2016 she was awarded one of the artist-in-residence spots at Glean, “a juried art program that taps into the creativity of artists to inspire people to think about their consumption habits, the waste they generate and the resources they throw away.” They work in partnership with Recology Portland; Metro, the regional government that manages the Portland area’s garbage and recycling system; and crackedpots, a nonprofit environmental arts organization.”
She most recently exhibited at Shift Gallery in Seattle and is currently working on a project, Morphogenesis, on weekends as an artist in residence at Mary Olson Farm and White River Valley Museum in Auburn, WA.
I was not surprised to see her work now includes an important educational aspect: marrying together aspects of art and science, putting the A into the STEM fields, echoing what is going on in the larger world with the arrival of STEAM. STEAM is an educational approach to learning that uses Science, Technology, Engineering, the Arts and Mathematics as access points for guiding student inquiry, dialogue, and critical thinking. The hoped-for end results are students who feel at home in scientific fields as well as the arts and use both approaches to enhance their problem solving and functioning in an increasingly data-oriented world. (Ref.)
Reports on the fruitfulness of collaboration between scientists and artists are more and more coming into view, and much is written about how creativity is a common denominator in the thinking of both professions.
In fact, two years ago, The Smithsonian turned to art to get out a message that scientists had been clamoring about loudly – and in vain – for decades with their tools of data-driven messaging. The exhibition, Unsettled Nature – Artists reflect on the Age of Humans, delivered information with an emotional punch, much of it sensitive photography of man-made ecological disasters, but also Bethany Taylor’s woven tapestries of varied ecosystems. Art was used to communicate the gravity of our planet’s situation established by scientific inquiry.
Bethany Taylor
Science organizations have started to acknowledge the important role that art can play, with some even holding juried art contests like, for example, the Materials Research Society, (MRS) with they annual Science as Art competition. Pictures are in the link – some pretty incredible!)
What I admire about Triplett’s approach is her ability to keep the interconnectedness of the two domains, art and science, in focus, but also remain dedicated to the language of her own field. Even with translation from the science end into the visual arts realm, there is a focus on playfulness that is a hallmark of her artistic practice. One that she shares with her students, encouraging them to experiment with tactile materials of all sorts and, importantly, try out how it feels to break the rules. There is a non-quantifiable, and in some ways non-translatable aspect to making art, one that centers on pleasure.
Not the pleasure of a satisfactory scientific result, or the pleasure of having had the right ideas now confirmed by the data, not the pleasure at one’s cleverness of designing a brilliant experimental design.
Instead it is the pleasure of the tactile exploration of fiber, seeing a fantasy or an imaginary construct come into existence, the freedom to bend the rules, to bring your very own creative impulses into the open. It is pleasure in the process, not linked to outcome. To this purpose, all participants are encouraged to create something with fiber, bits and pieces that can be selected from a basket. The growing display on the walls of the Hoffman Gallery are proof positive how playfulness translates into beauty.
***
“The best thing on translation was said by Cervantes: translation is the other side of a tapestry.” — Leonardo Sciascia
We’ll see the final sculpture, the translation tapestry, in August at Maryhill Museum. Or the other side of it, as the case may be. In the meantime, here is my own data collection during the interview, trying to weave stories out of snippets. Then there’s my data visualization with fiber remnants, translating interconnectedness, flow and play. In the spirit of Lewis Caroll’s remarks:
“When I use a word,’ Humpty Dumpty said, in rather a scornful tone, `it means just what I choose it to mean — neither more nor less.”
“…a collaborative fiber arts project featuring 13 artists working with communities along a 220-mile stretch of the Columbia River from the Willamette River confluence to the Snake River confluence. The project, again initiated by Maryhill Museum of Art and following the original one by printmakers in 2019, takes inspiration from the Surrealist art practice known as exquisite corpse. In the most well-known exquisite corpse drawing game, participants took turns creating sections of a body on a piece of paper folded to hide each successive contribution. When unfolded, the whole body is revealed. In the case of The Exquisite Gorge Project II, the Columbia River will become the ‘body’ that unifies the collaboration between artists and communities, revealing a flowing 66-foot work that tells 10 conceptual stories of the Columbia River and its people.”
Artists and Community Partners:
Section One: Oregon Society of Artists–Artist: Lynn Deal Section Two: Lewis and Clark University–Artist: Amanda Triplett Section Three: Columbia Center for the Arts, The History Museum of Hood River County and Arts in Education of the Gorge–Artist: Chloë Hight Section Four: White Salmon Arts Council and Fort Vancouver Regional Library–Artist: Xavier Griffith Section Five: The Dalles Arts Center and The Dalles-Wasco County Library–Artists: Francisco and Laura Bautista Section Six: The Fort Vancouver Regional Library at Goldendale Community Library–Artist: Carolyn Hazel Drake Section Seven: The American-Romanian Cultural Society and Maryhill Museum of Art–Artist: Magda Nica Section Eight: Desert Fiber Arts & REACH Museum–Artist: Ophir El-Boher Section Nine: The Confederated Tribes of the Umatilla Indian Reservation–Artist: Bonnie Meltzer Section Ten: ArtWalla–Artist: Kristy Kún Frontispiece: Tammy Jo Wilson and Owen Premore
Section 2 Group featured today:
The Exquisite Gorge Project II: Fiber Arts: Section 2 features the work of the following Lewis & Clark student artists:
Brynne Anderson, Melissa Even, Margo Gaillard, Jones Kelly, Haley Ledford, Ella Martin.
More folks who have been apart of the process and supported the project:
Tammy Jo Wilson, Visual Arts & Technology Program Manager, Professor Matt Johnston, Art History, Professor Jessica Kleiss, Environmental Studies, Professor Lizzy Clyne, Environmental Studies, Justin Counts, Educational Technology Specialist, Mark Dahl, Director of Watzek Library, Ethan Davis, Digital and Data Science Specialist, Parvaneh Abbaspour, Science and Data Services Librarian, Rachel McKenna, Art Department 3D Technical Support, Kate Murphy, Community Organizer, Columbia Riverkeeper, The Columbia Fiber Arts Guild, Lewis & Clark Students: Katie Alker, Francisco Perozo, Gwenneth Jergens, Ava Westlin, Sarah Bourne.